An alternative metric to EPA for evaluating and predicting NFL team performance
HC

TL;DR
Drive Quality is an NFL model focused on systematically capturing the efficacy, durability, and reproducibility of drive-level performance, independent of actual scoring outcomes
This can yield more accurate explanations of how well a team moved the ball in the past, and in turn, how likely they are to move the ball and score points in the future
A metric we are calling "Earned Drive Points", an output from Drive Quality, outperforms EPA in capturing drive-level efficiency and stability
EDP has promising backtested (and real-world) results and can potentially offer new predictive insights into short-term and season-over-season team performance
The Seeds of Drive Quality
The broader football analytics community has made significant strides over the years to better understand, explain, and predict many of the complex and dynamic features of the game, but drive-level metrics have remained an underexplored terrain, and in my opinion, an underappreciated source of intelligence for more holistically understanding NFL team performance.
In earlier work with PFF, Ben Brown and I explored the advantages of considering drives, as opposed to plays, as a possible alternative unit of analysis. The concept generated some interest but a more thorough investigation was still needed. In the meantime, there was still no metric to quantify drive level play and the question persisted: "what’s an effective method to systematically capture the signal of a drive without its noise?" The goal was to isolate the quality of how well a team moved the ball and how reliably they could reproduce that result in the future, neatly separated from any nonrepresentative “fluky” outcomes.
This sparked the Drive Quality project and a metric called Earned Drive Points (EDP). A team generates EDP by “earning” points, which is indeed distinct from simply scoring points. Points can be scored in a variety of ways, but the quality of points scored can generally be described as earned or unearned depending on various factors that we’ll discuss in this note. EDP is accumulated based on the overall efficacy, durability, and reproducibility of the in-scope drive — independent of realized (and unrealized) scoring outcomes. Its intended purpose is twofold; to descriptively quantify how well a team played on a given drive, while also serving as the basis for predicting how well a team will perform on future drives.
Drive Quality Is Not EPA
To be clear, Drive Quality is not an Expected Points (EP) model in disguise. Expected Points Added (EPA), which is derived from its EP model, can of course capture certain elements of drive-level efficiency when aggregated, but it has meaningful limitations for our stated goals. Exploring the philosophical differences will perhaps better allow us to understand Drive Quality and the process behind creating our Earned Drive Points metric.
The use of EPA is ubiquitous across NFL fan, betting, DFS, and academic circles. However, in its most popular form, EPA is a play-level, not drive-level, metric. The EP model projects “expected points” (for the result of a drive) on a play accounting for various contextual factors. EPA then measures realized production (backward-looking) relative to its own modeled expectation. The assumptions to calculate these expectations answers the following question: “Assuming down, distance, and field position — among certain other situational variables— what are the average points an average team can be expected to score?”
The EP/EPA framework assesses performance of all teams (be it the elite Bills or the lowly Bears) using a uniform baseline standard. This can be a useful framework, but it perhaps distorts the meaning of “expected points.” Let us look at a real-world example of the NFLfastR EP model for teams on the first play of their drives in the 1st quarter of their 2022 games:
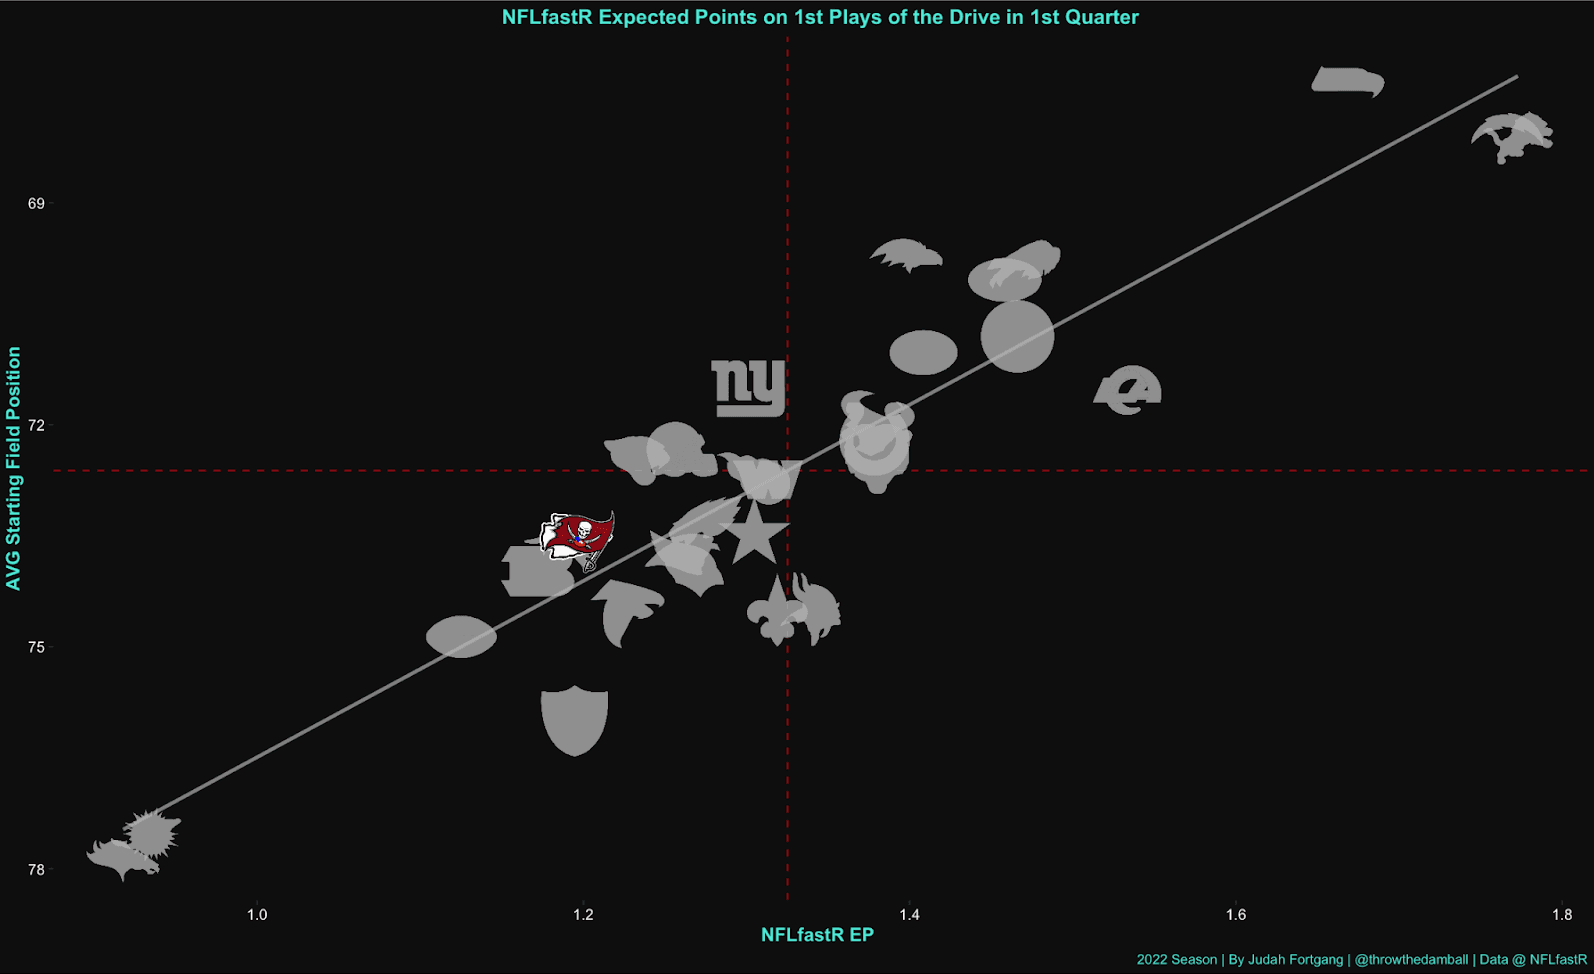
OK, let’s break down what we’re looking at here. In the chart above, we see a near perfect linear relationship (R value .92) between starting field position and expected points (gray line) with almost no relationship between expected points and team strength (however defined). Field position matters, of course, but we wouldn’t expect the 2022 Bucs and 2022 Chiefs to have the same scoring expectations when starting with the same field position. If we want to truly capture a team's expected points, perhaps we should consider a team's known strengths, weaknesses, and tendencies, filtered through the lens of specific matchups and game situations.
The second potential shortcoming of the EP/EPA framework— insofar as the goal is to evaluate how effective and sustainable or reproducible a drive is—is that it doesn't discriminate the method by which a team gains or loses yards or how they arrived at the outcome of the drive. Instead, it merely registers the result and subtracts it from assumed expectation.
Let’s use some examples to illustrate potential issues here. Team A starts on their own 20, gains 75 yards on 10 plays to set up first and goal from the 5. On the next play, the center snaps the ball before the QB is ready and the defense recovers the fumble. Using an EPA framework, this would result in a net negative EPA drive. But does this accurately reflect the true fundamental value of the drive in its totality? What’s a stickier and more actionable source of information for future decision-making from the perspective of a bettor, fan (or even a coach): the impressive (larger sample) performance before the fumble or the result of the drive? Or take Team B’s drive where, on the first play of the drive, a CB slips and the offense throws an 80 yard touchdown as a result. Which drive is more notable in its totality: Team A or Team B?
The thesis behind Drive Quality is simple: The method by which a team gains their yards matters, particularly in relation to the plays that precede and follow. In the volatile arena of football, focusing on the process of drives rather than their sometimes-arbitrary outcomes can yield more accurate explanations of how well a team moved the ball in the past, and in turn, how likely they are to move the ball and score points in the future.
Modeling EDP
Now that we’ve set the stage, let's delve into the mechanics of modeling EDP. Like EP, we start by creating a custom score expectation for each play, engineered by training an XGBoost model on two decades of NFL data. This model contains the same situational factors as the EP model, but crucially, it also includes variables folding in team strength (offensive and defensive)— through rolling long and short-term efficiency metrics such as yards per play, success, explosive plays, sack rate, etc.— and factoring specific game-state situations. For example, the probability of the Eagles or Bengals (prolific offenses that can succeed passing even in obvious passing situations) to convert on third and long or to mount a comeback when down by 14 in the 4th quarter is not the same as the Texans or Falcons.
Now, let's visualize this. We’ll examine the same chart from before, but this time through the lens of Drive Quality's scoring expectations:
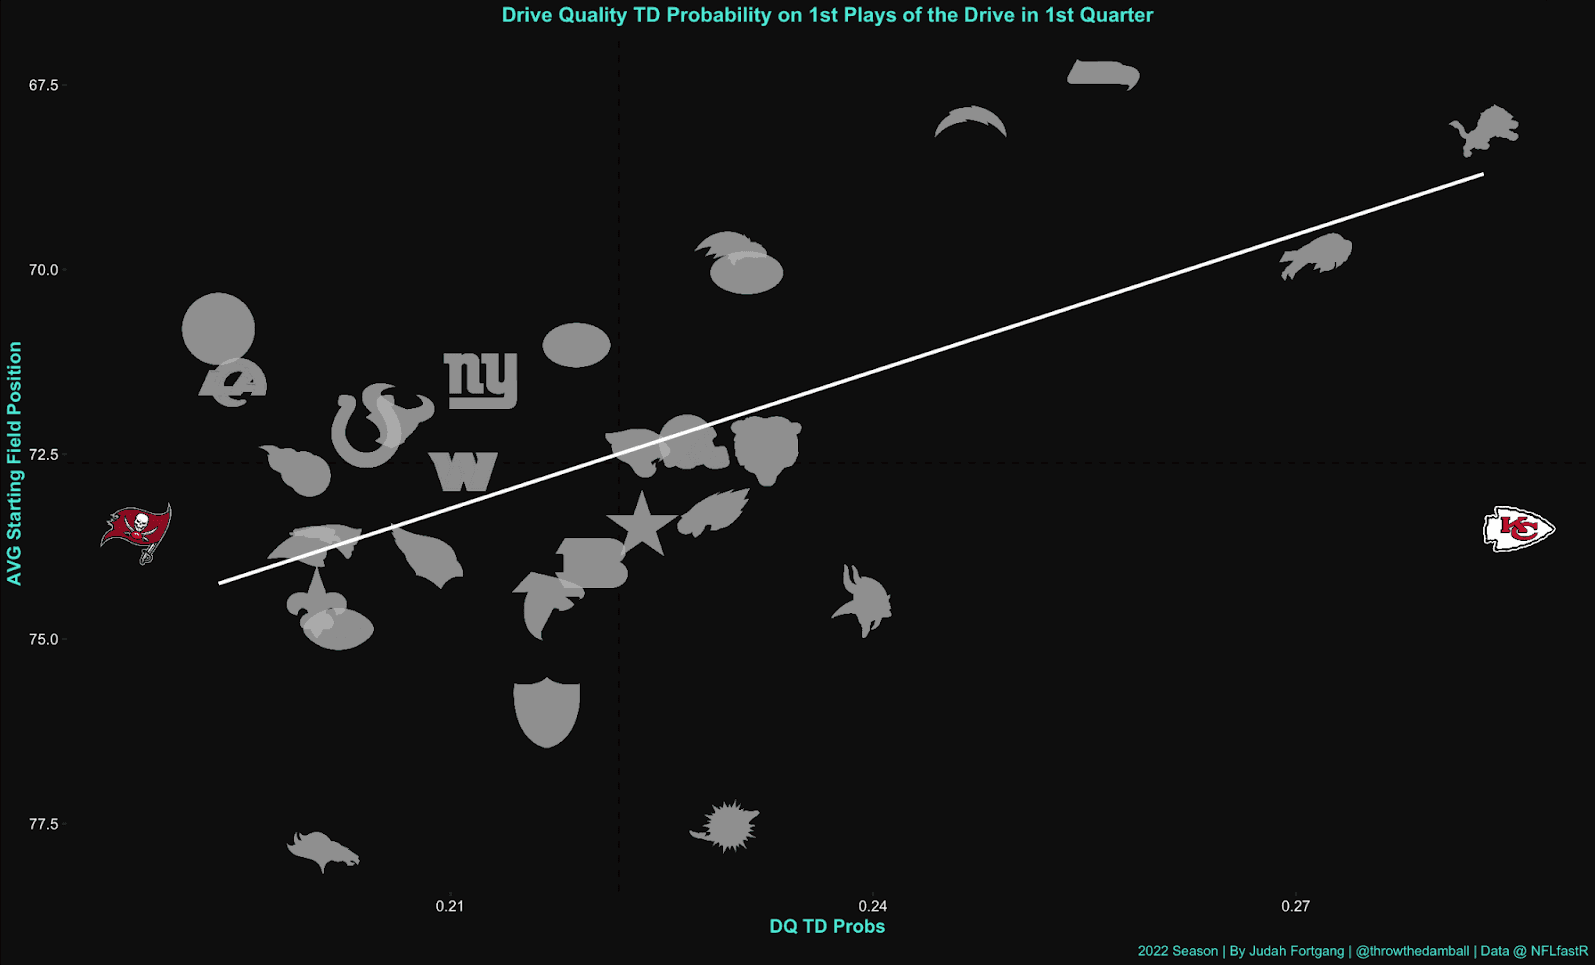
Naturally, we still see a relationship between starting field position and scoring expectations, but the slope of the line is far less steep than the NFLfastR version (0.41 R value). This makes intuitive sense, since our Drive Quality model accounts for a variety of factors, namely team-specific performance variables. Most importantly, we can see the Chiefs and Bucs do not have anywhere near similar scoring expectations when starting drives in the same position, which more accurately reflects the reality of “expected points.”
Now of course this chart should not be confused for one that examines team efficiency— we’ll get to that soon— but it should illustrate the differences between our models. Drive Quality does not compare teams to a theoretical average team in an average matchup, irrespective of other material data points. Rather, a team’s expectations are calculated relative to their specific DNA and opponent environment, and calibrated to account for the broader overarching context of that team’s specific past performance over short-term and long-term periods. Put succinctly, a team’s future expectations are modeled on their most relevant past selves, producing a more accurate, apples-to-apples evaluation.
But how does our model determine the number of points “earned” on a drive? EDP is most heavily influenced by four categories of variables: The first is the probability points gained over the course of a drive. But not all probability gains are created equal. Our second category accounts for the volatility of how you earned those points. Teams who had bigger probability swings— think huge explosive plays, or many drives with late down conversions— get nicked a bit relative to those who sustained their success on early downs and without the benefit of one huge play. The third category accounts for the average score probability on a drive relative to its starting expected points. This favors teams that spend more of their drive in opposing territory and in favorable situations, adjusting for initial drive expectations so that there is no leaking whereby the best teams have higher score probabilities by virtue of being better teams. The last category is a modified yards-per-play variable to reflect the undeniable link between gaining yards and earning points, which also accounts for subtle distortions in probability gain such as yards gained from penalties.
Backtested Results
Now that we have explored the theory behind EDP, let's look at some backtested results.
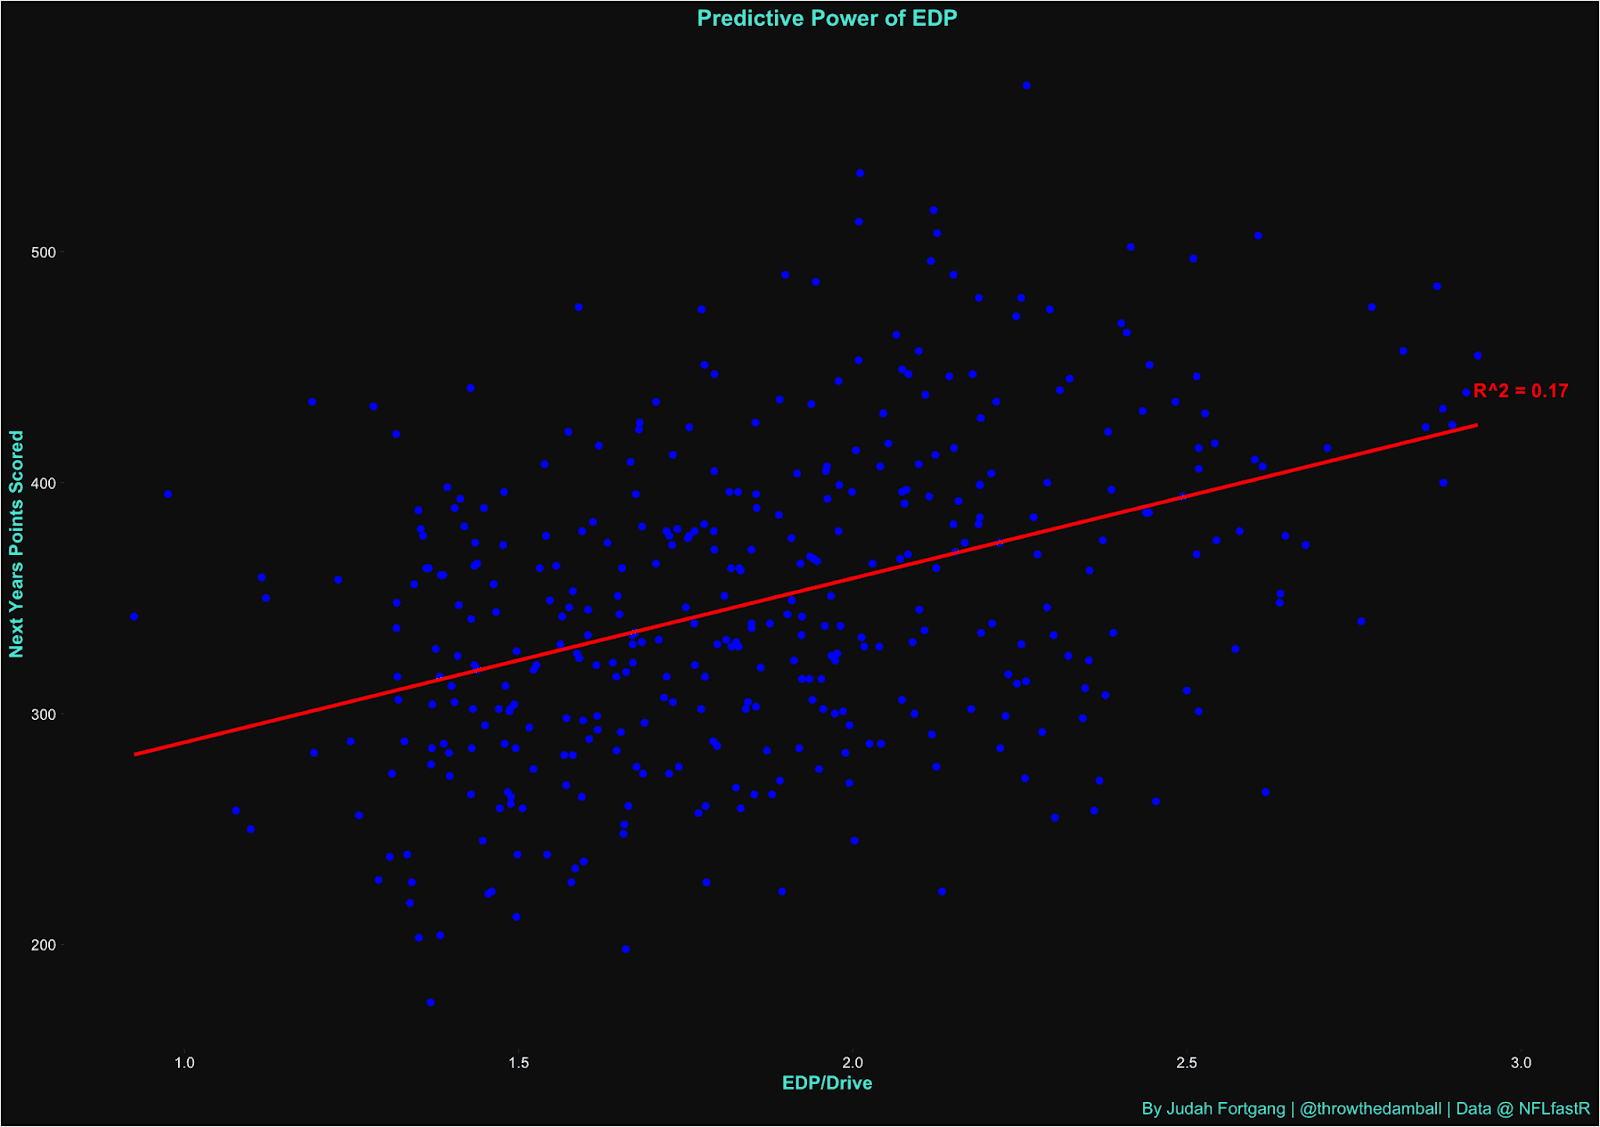
From season to season our EDP metric captures nearly 17% of the variance in predicting future point production, compared to only 13% for EPA/Play in the same category. And as we will discuss below, when using short term samples, EDP’s predictive capabilities for future production only increases.
But is the metric at all stable? Let's examine the stability of EDP over a few points in time.
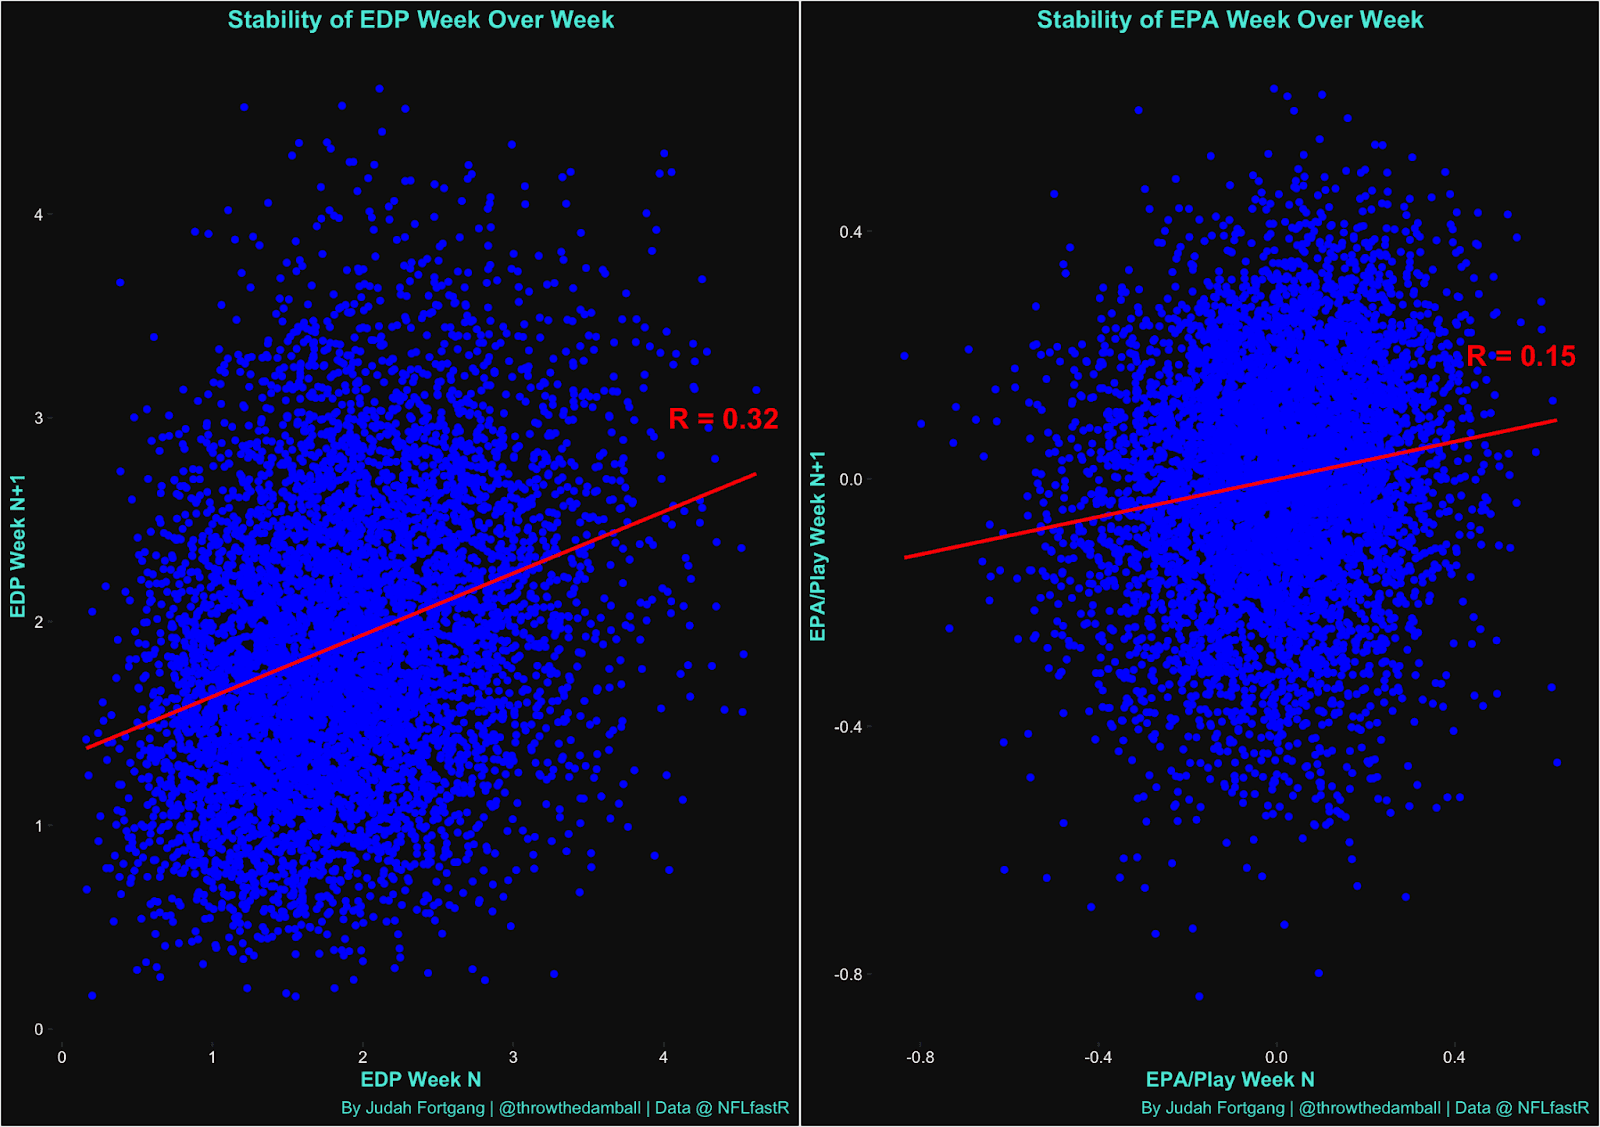
On a week-to-week scale, we see that EDP is remarkably stable, more than twice as stable as EPA/Play and Success Rate (Success Rate has a similar R value at 0.17). No matter what time frame you use to slice it, perhaps because of our team strength adjustments, EDP is remarkably stable.
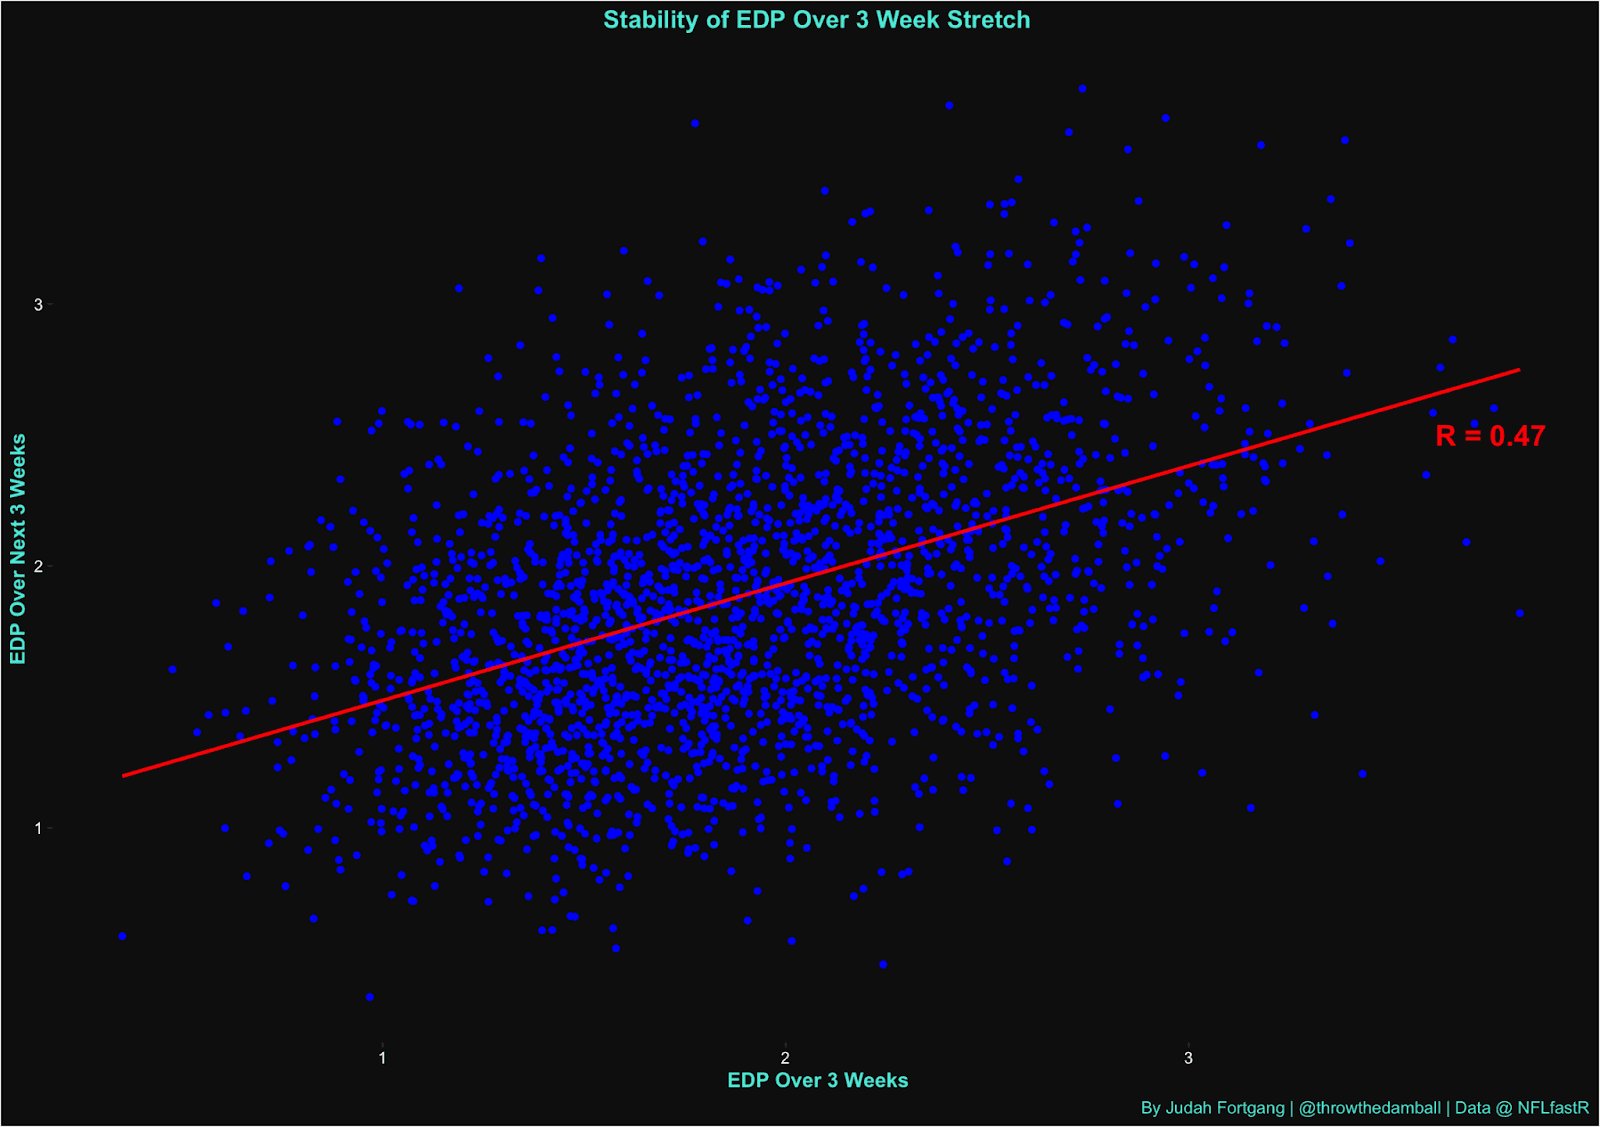
EDP offers compelling predictive insight into a team's short-term results (one of the most difficult to predict timeframes). Using a 3 week/3 week scale, EDP’s stability jumps to an R value of .47 (whereas EPA/Play and Success rate are at .29 and .31 respectively). And in predicting next offensive points scored over the same period, EDP has an R value of .27 vs .21 for EPA and Success Rate. Season-over-season, EDP has an R value of .51, which is again, tops among public efficiency metrics.
Below is a summary chart of some of the correlations we discussed.

The defensive side of the ball reveals the same story, with EDP far outpacing EPA, with the most pronounced performance over the short term.

These results, then, seem to confirm our stated goals. EDP is far more reproducible and stable than any common efficiency metrics on offense and defense and over various time periods. And while by no means is EDP meant to be an exact predictor of future point production— and how to use EDP to model spreads is a note for another time— it is seemingly a solid base to predict how well teams will produce on future drives.
Applications
Drive Quality’s practical applications are diverse. Last season, it was primarily used to generate macro power rankings, which were immensely helpful in isolating over- and underrated teams relative to consensus market expectations. After all, as just seen, EDP is at its strongest in pricing short term results. This season, here at SportfolioKings, we hope to expand the scope of Drive Quality for more fine-tuned purposes, such as pricing individual matchups for pregame betting and creating team volatility profiles for live betting.
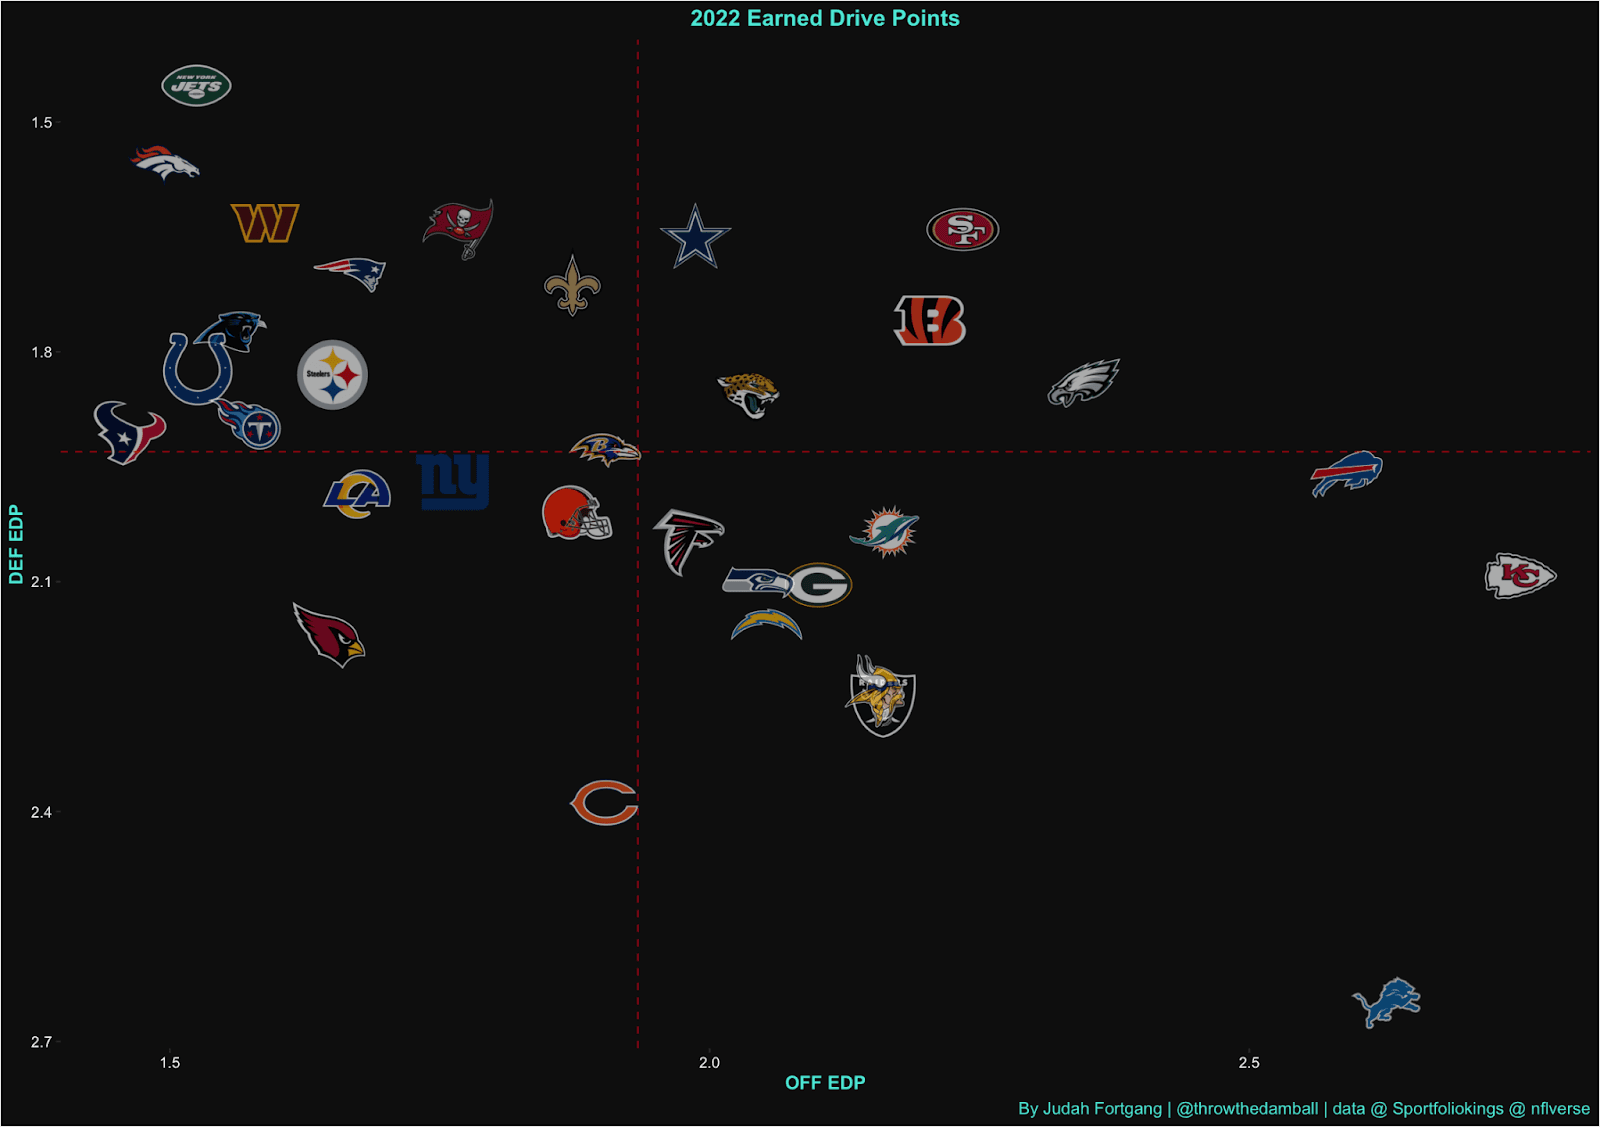
Of course, EDP can also capture team level efficiency such as the graph below which outlines how each team fared by our metric in 2022.
Likewise, because the goal of metric is designed to capture a team’s efficacy and reproducibility of their drives we can easily look at the volatility and ranges of outcomes for teams performances such as this chart below which graphs the distributions for teams offensive performances and further details a teams performance and stability.
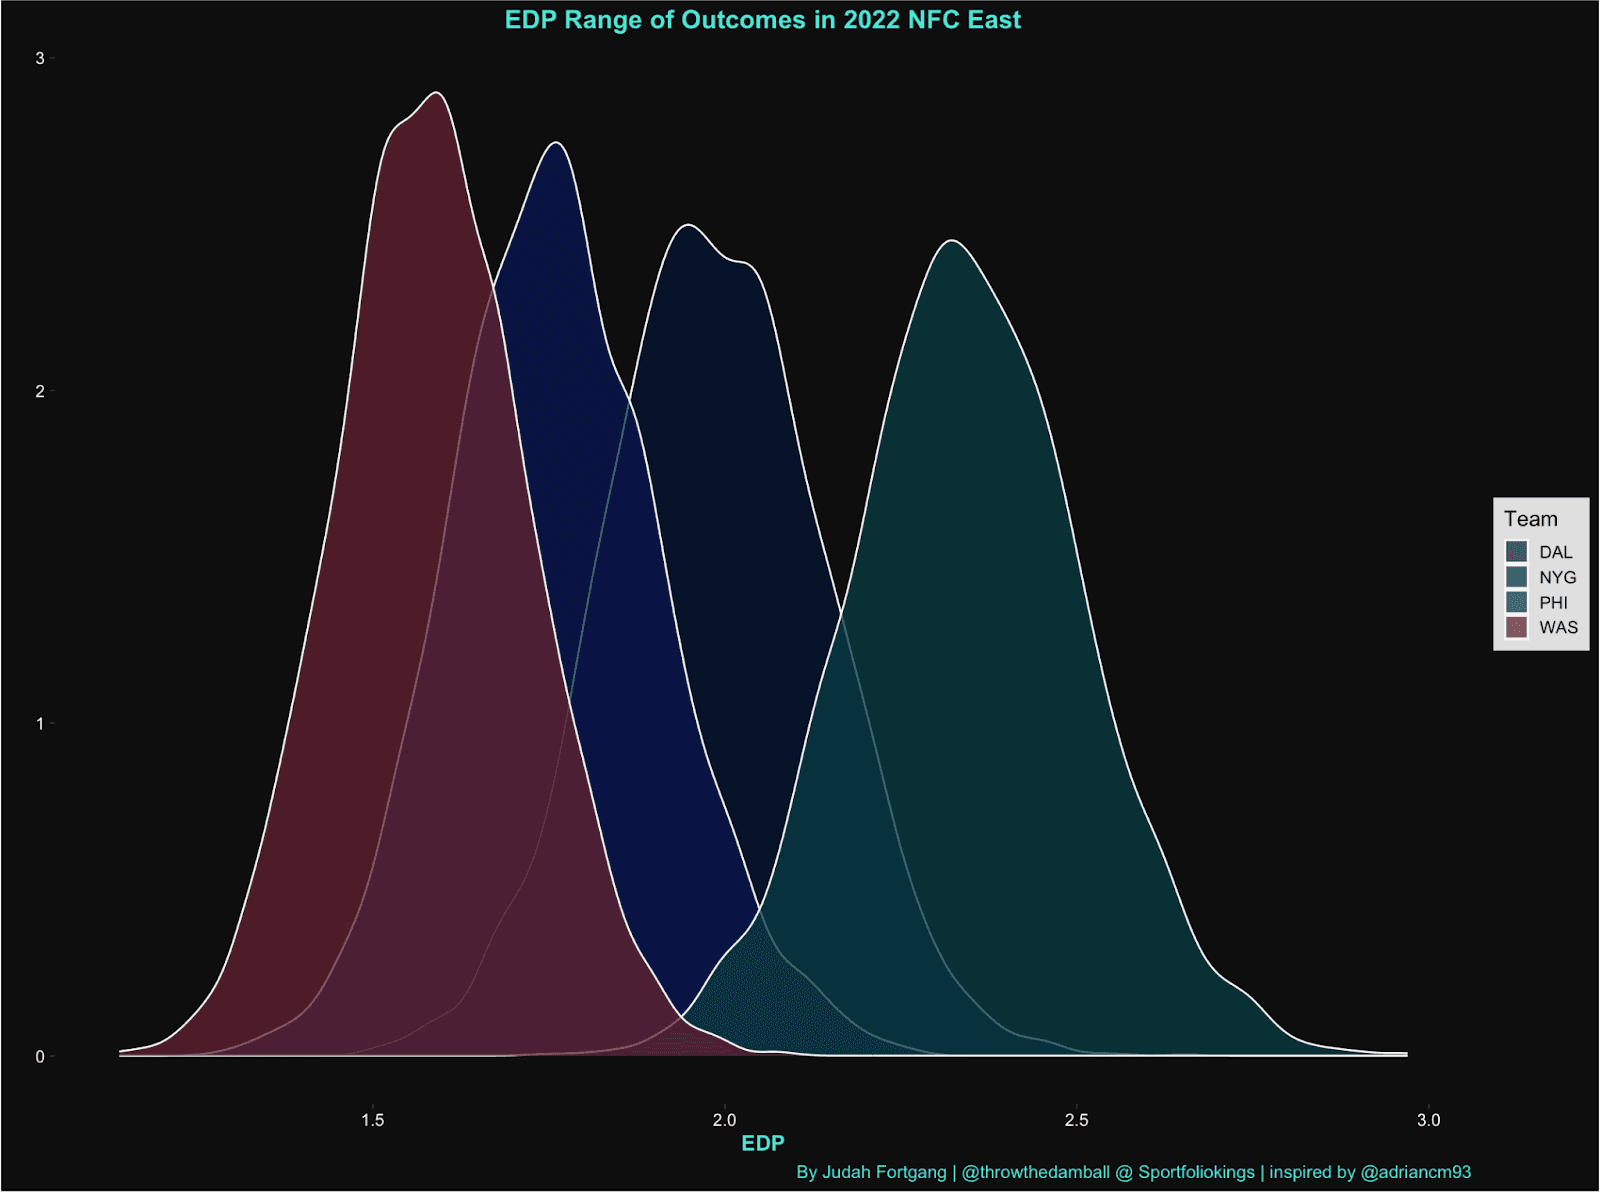
For instance, as you can see with the “higher peak,” the Football Team has a more consistent and less volatile range of outcomes than their NFC East counterparts.
But perhaps its most versatile use as an efficiency metric (and likely its most provocative) relates to its ability to generate post hoc representations of final scores. Of course, this is not a novel idea but the hypothesis is that there is considerable edge to be had from this single attack vector alone.
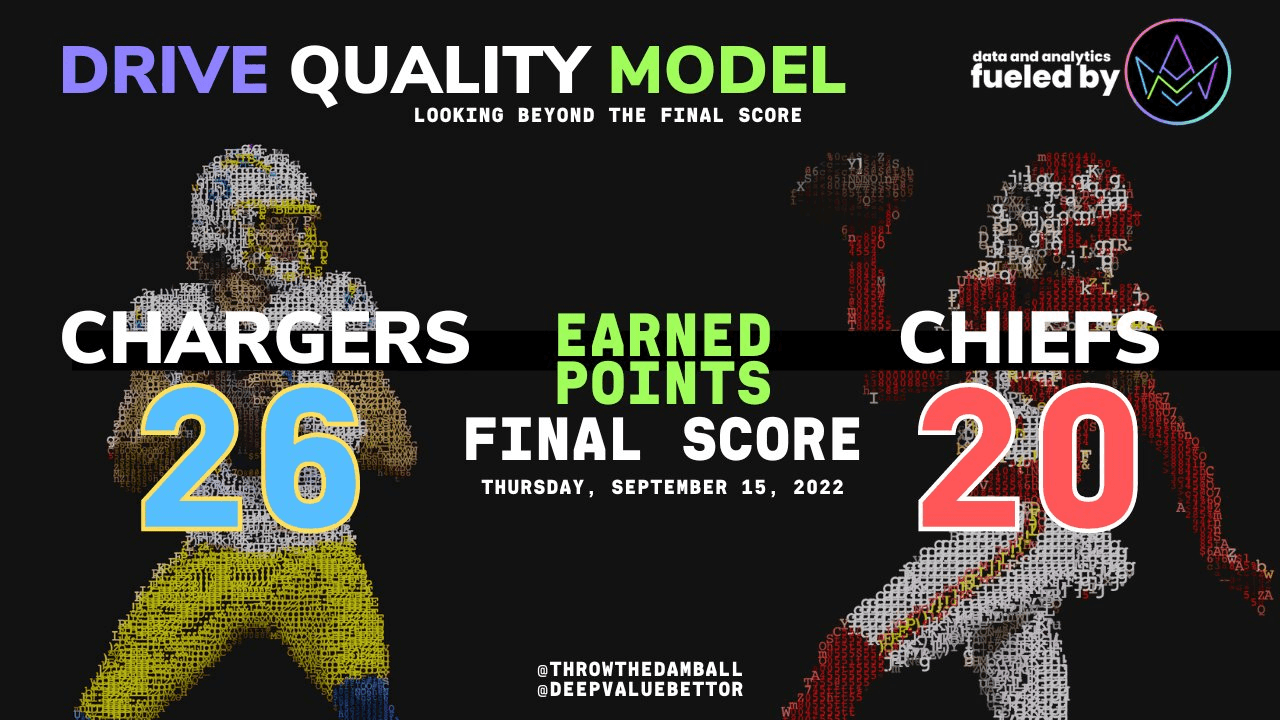
As we have discussed, depending on the distribution, volume, severity, and additive or punitive nature of fluky plays, the result of a game is sometimes a permanent inaccurate memorialization of a team’s standalone and relative performance. From a betting perspective, this ostensible discrepancy and the influence on fan, media, and bettor perception can be incredibly important to discern and properly account for. Whether justified or not, official final scores reign supreme – confirming handicapping biases, cashing or shredding tickets, and serving as a benchmark reference point for bettor, analyst, and fan citations to support some future hypothesis (who become over time increasingly desensitized to its erroneous underpinnings). This persistent inefficiency can create potential distortions in the transmission mechanism of market prices for teams and matchups and therefore a possible consistent source of alpha generation.
Conclusion
EDP is by no means a final product. This means Drive Quality will likely remain in a perpetual state of development, iterating on the model as we uncover flaws and discover sources of enhancement. Indeed, it must evolve, as the NFL evolves, and as betting markets evolve.
But even at this early stage, EDP is a promising step towards developing a serious drive-level metric that demonstrates stability and captures the essence and reproducibility of drive success. EPA, Success Rate, and other analytical metrics are of course still valuable sources of information, but we hope that EDP can enter the conversation alongside it– a dynamic and contextually aware metric that perhaps better describes current team performance and more reliably predicts future team performance, from both an offensive and defensive perspective. But most of all, we hope this project continues to push and improve our understanding of the game, while serving as a critical tool to increase our understanding of the game and our bottom lines.


