Introducing an enhanced Pythagorean-based strategy for betting NFL win total futures
HC

TL;DR
The Pythagorean Expectation (Pythag 1.0) has been a popular method for evaluating NFL team performance, using point differentials to estimate how many games a team "should have" won.
A new approach called Pythag 2.0 incorporates betting market dynamics to enhance evaluation accuracy, using points scored and conceded in excess of expectation.
Quantitative analysis using machine learning models shows that Pythag 2.0 outperforms Pythag 1.0 in terms of next season wins correlation, variance explanation, and feature importance, suggesting superior predictive power.
Historical testing of betting strategies using Pythag 2.0 shows that it yields higher returns and better risk-reward balance compared to Pythag 1.0. Different threshold levels for betting edges are explored, and a mixed strategy combining both Pythag models shows promise.
While Pythag 2.0 offers an improved perspective for NFL win total futures betting, it still has significant limitations and further research is needed to explore its tactical applications.
Intro
As the aroma of hot garbage sweeps through New York City, so too does the sizzling anticipation of the upcoming NFL season.
Fans are dissecting team rosters, analyzing offseason developments, and dreaming up the dramatic narratives to unfold over the next six glorious months.
For sports bettors, it's a familiar hunt for that ever-elusive edge, with a particular focus during the summer months on season-long futures. A trusted ally in this pursuit has long been the Pythagorean Expectation, a mathematical lighthouse guiding bettors toward a truer representation of a team’s past performance (or so the belief goes).
Last summer, we started a project to examine the validity of this widely accepted and ubiquitously referenced NFL framework. The result of our research is an alternative starting point for constructing NFL win total bets: a tweaked version of Pythag we call Pythag 2.0.
It’s an unimaginative name, but a delightfully intuitive and clever methodology that draws from the strengths of the original while introducing a modern, market-driven adjustment. In this note, we'll delineate our modifications to the Pythag equation, establish the enhanced predictive power of Pythag 2.0, and present the findings from a 20-year backtest of betting performance using both the classic Pythag and Pythag 2.0 models.
What is the Pythagorean Expectation (aka Pythag 1.0)
First devised by renowned baseball analyst Bill James and later adapted for the NFL by Football Outsiders, the Pythagorean Expectation has become a respected standard over the years for ostensibly separating a team’s 'true' performance from their ‘on paper’ performance.
But how does it work?
The Pythag framework is built on point differentials — using the ratio of how many a team scores and how many they surrender over a season. The calculated output* is an estimate of how many games a team “should have” won or lost.
The assumption here is straightforward: a team that scores more points than it gives up is more likely to win future games. The computed Pythagorean win totals then provide bettors with an enhanced understanding of potential incongruities between a team's perceived and actual performance. It’s this guiding light that many have often relied on to help discern whether a team may be under- or over-rated relative to current betting market pricing.
And there is some merit to this claim.
Pythag holds a notable predictive edge over mere historical win-loss records. The correlation between a team's actual wins and their wins in the subsequent season stands at 0.33.
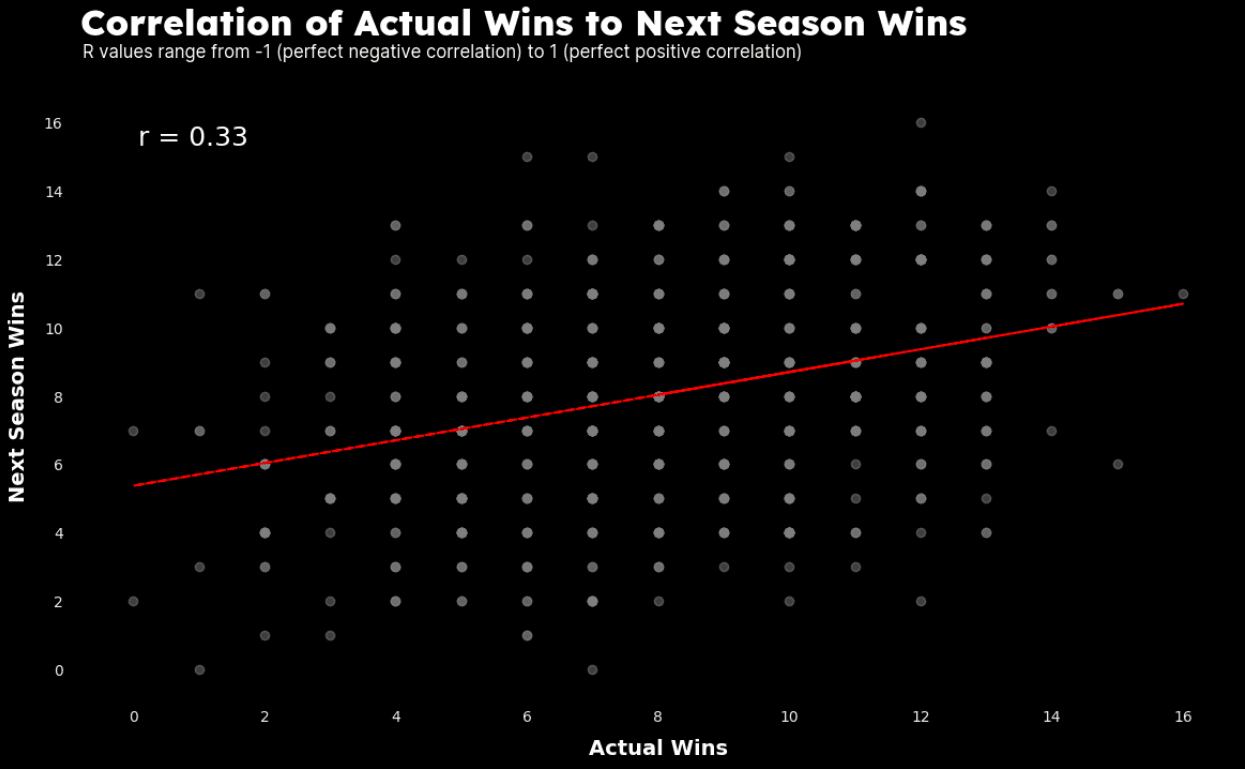
However, when we substitute actual wins with Pythagorean wins, this correlation improves to 0.37.

This difference, while seemingly marginal, is still noteworthy when it comes to assessing the value of Pythag, and demonstrates there is indeed some edge to be had by using Pythag wins instead of a team’s actual wins to predict next season wins.
Hello, Pythag 2.0
The thing is, if you want to consistently capture alpha in competitive markets, you must continually question the status quo. We started this project with an intuitive but powerful premise: Teams that consistently outperform market expectations are likely more potent than their win-loss records imply, while those that underperform market expectations are likely hiding weaknesses that may still be underappreciated by market participants.
Pythag 2.0 tackles the inherent shortcomings of the Pythag expectation by harnessing the power of betting market dynamics, shifting the focus from total points scored and conceded to points scored and conceded over expectation, as determined by closing spreads and totals.
Let’s use an example to illustrate the differences. If the Bengals were 14-point favorites and beat the Texans 20-10, the Bengals would earn +10 points under the original Pythag framework but would earn -4 points under the Pythag 2.0 framework.
This is a visibly stark contrast in how the two methods evaluate outcomes.
By anchoring our analysis to expected performance, we extract a more predictive insight – filtering the team’s actual performance through the wisdom of betting market forecasts, which account for up to date information, mismatches, injuries, etc.
Beyond this, Pythag 2.0 also gives birth to a trio of new descriptive metrics for in-season use:
Active Points Scored (APS),
Active Points Conceded (APC),
and their cumulative result, Active Points Total (APT)
“Active” is a term borrowed from traditional finance to indicate the delta between realized performance and benchmark performance (in our case, the benchmark is betting market expectations).
Now let’s return to our Bengals vs. Texans example and extract these metrics. If the score is Bengals 20 and Texans 10, but the Bengals were 14-point favorites with a 54-point total, then the Bengals were expected to score 34 points and concede 20 points. As such, their
Active Points Scored would be -14 (i.e., their offense underperformed),
Active Points Conceded would be +10 (i.e., their defense outperformed),
and Active Points Total would be -4 (i.e., the team net-net underperformed, despite still winning the game by 10)
We'll likely make some more situation-based adjustments to these (such as accounting for ST and DEF scores). Collectively, these metrics provide a fresh lens to scrutinize NFL teams over the course of a season (and will be available on our Sportfolio Terminal this coming 2023 season).
Numbers Don't (Usually) Lie: Quantitative Analysis Supporting Pythag 2.0
Machine learning models can be powerful assets when it comes to untangling complex relationships in data. They can detect subtle patterns and determine which variables offer the most predictive insight. During this project, we used several different models, from Linear Regression to Random Forest to XGBoost to Principal Component Analysis (PCA), to test our hypotheses and ensure Pythag 2.0 isn't merely an attractive theory but one with robust empirical support.
The result produced a clear and recurring theme: that Pythag 2.0 had superior correlation, variance explanation, and feature importance than the original Pythag. This means that, when predicting a team’s wins for the next season, Pythag 2.0 demonstrated greater influence and accurate predictability (at least according to the various ML models used in this exercise). Let’s take a closer look at the results.
Correlations
Beginning with a relatively basic correlation analysis (which we also used earlier to evaluate how a team’s actual wins and Pythag wins correlate to next season wins), we observe that Pythag 2.0 enhances the R value from 0.37 to 0.38. Though the improvement is not radical, it is indeed a step forward.
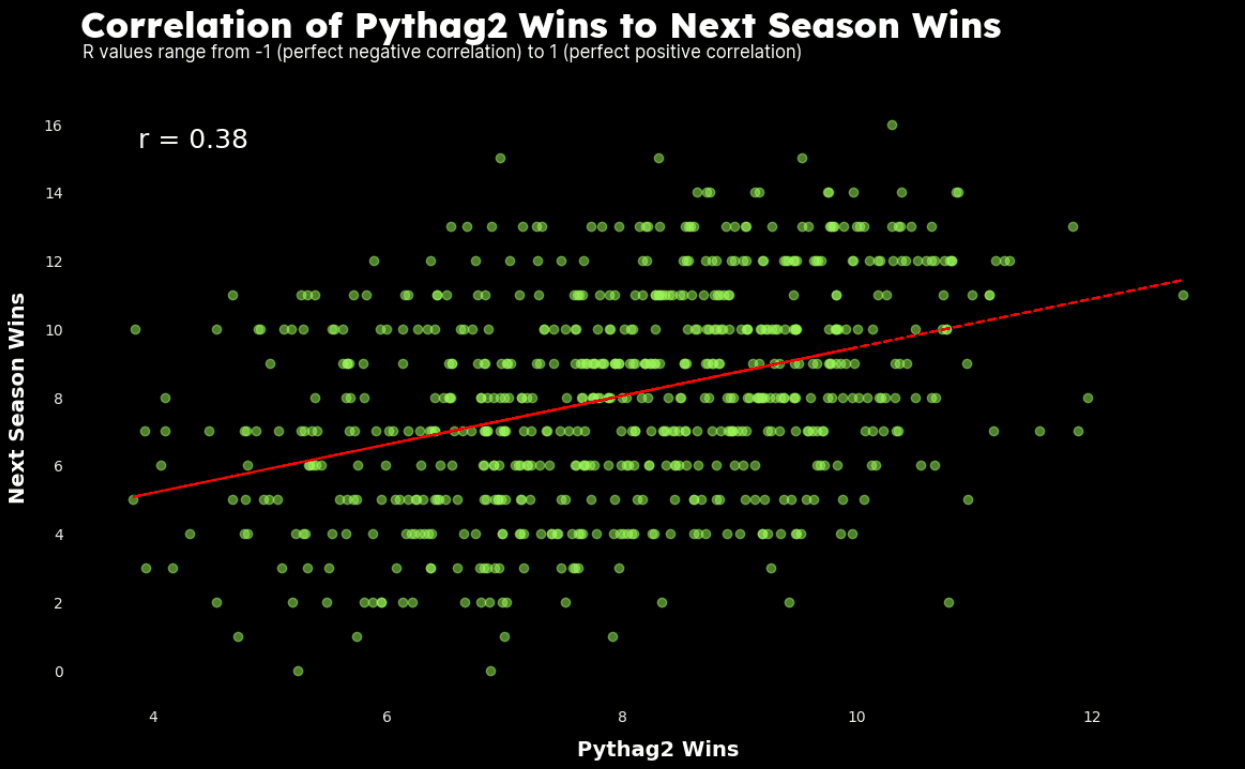
Next, we built a Linear Regression model using a cross validation process to study the dynamics between our predictors (Pythag and Pythag 2.0) and the target variable (next season wins). To enrich the context of this analysis, we also included NFL win total futures as a third predictor, recognizing they embed far more timely information than either Pythagorean variant.
The R^2 score helps us understand the relative predictive power of our selected variables for explaining the variance in next season wins. Again, the improvement isn’t mindblowing, but Pythag 2.0 wins out.

As we dig deeper and incorporate these models into systematic betting strategies, the divergence between the two Pythagorean cousins becomes more conspicuous.
Feature Importance
‘Feature importance’ is a staple in machine learning that allows us to evaluate the significance of each variable used to feed our predictive ML models. In simple terms, it tells us which variable, when changed, causes the most significant ripple in the outcome.
Below we show the results of an Ensemble Learning model, a technique that merges predictions from multiple ML models to enhance overall accuracy. This strategy simulates a 'wisdom of the crowd' approach, benefiting from the strengths and offsetting the weaknesses of any individual ML model.
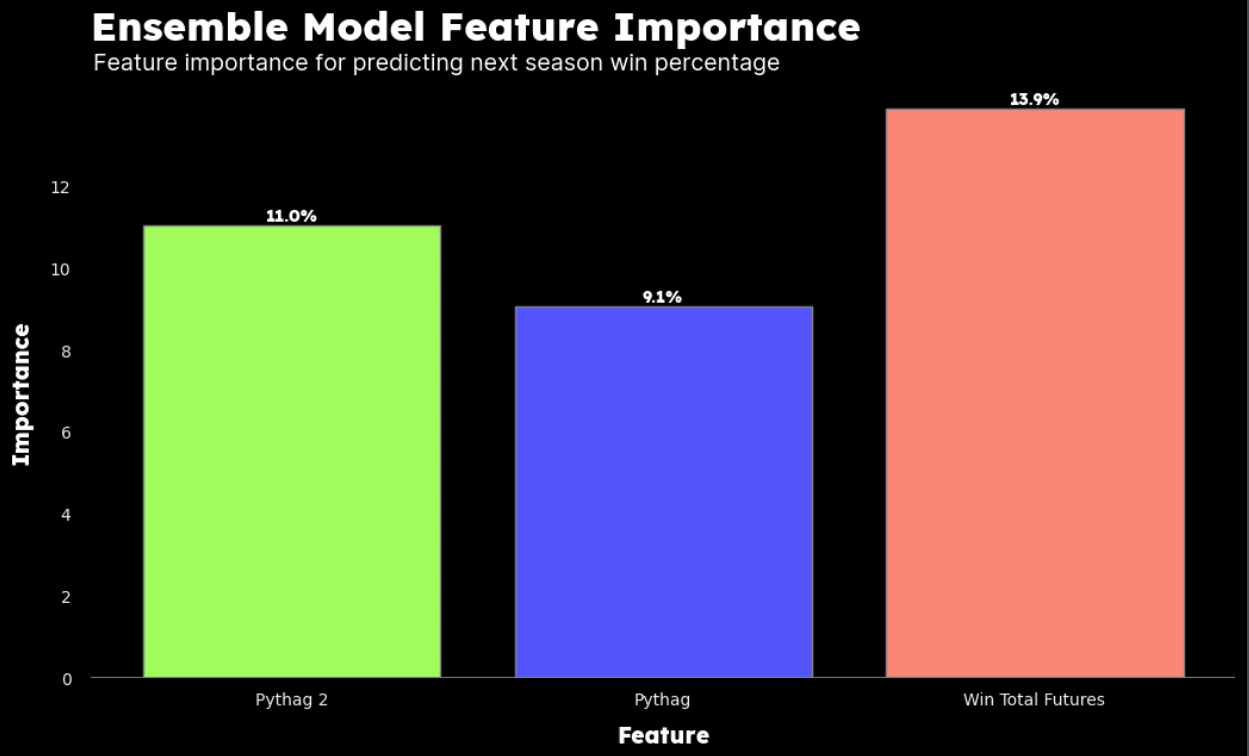
The results above align with our initial assumptions, that Pythag 2.0 would prove to be of greater predictive importance. But to our surprise, it even performed quite admirably relative to the far more information-aware NFL win total futures variable.
Application of Pythag 2.0 in Betting Strategies
Of course, theory is only as good as its practical application. We next wanted to assess the historical performance of Pythag 2.0 vs its predecessor when used as a standalone signal for betting NFL win total futures over the last 20 years. For an extra twist, we also included a ‘hybrid’ blended strategy that assumes the bettor allocates 40% of their budget to Pythag model recommendations and 60% to Pythag 2.0 model recommendations.
Our strategy was simple: Bet $100 on 'Over' if the relevant model calculated a team had more wins than actual wins the previous season, and $100 on 'Under' if it calculated fewer wins. The assumption is that if a team played better than their actual results the previous season, this may not be properly appreciated by the market and the team may be undervalued the next season, and vice versa.
Of course, this a relatively naïve strategy and surely doesn’t consider a massive amount of important data, including roster changes or other relevant details specific to the next season, such as schedule. However, these limitations always existed with the original Pythag methodology and there is an element of beauty in simplicity.
Unconstrained Strategy
In our first strategy, we made a bet whenever there was any difference between the model’s calculated wins and the team’s actual wins. Let’s use the Lions as an example (who were 9-8 last season). If the Pythag model calculated 9.5 wins, the Pythag strategy would bet the Lions over the next season. If the Pythag 2.0 model calculated 8.7 wins, the Pythag 2.0 strategy would bet the Lions under the next season. We used actual closing odds for both over and under bets (as opposed to a static -110), so profit/loss results would closely mimic reality.
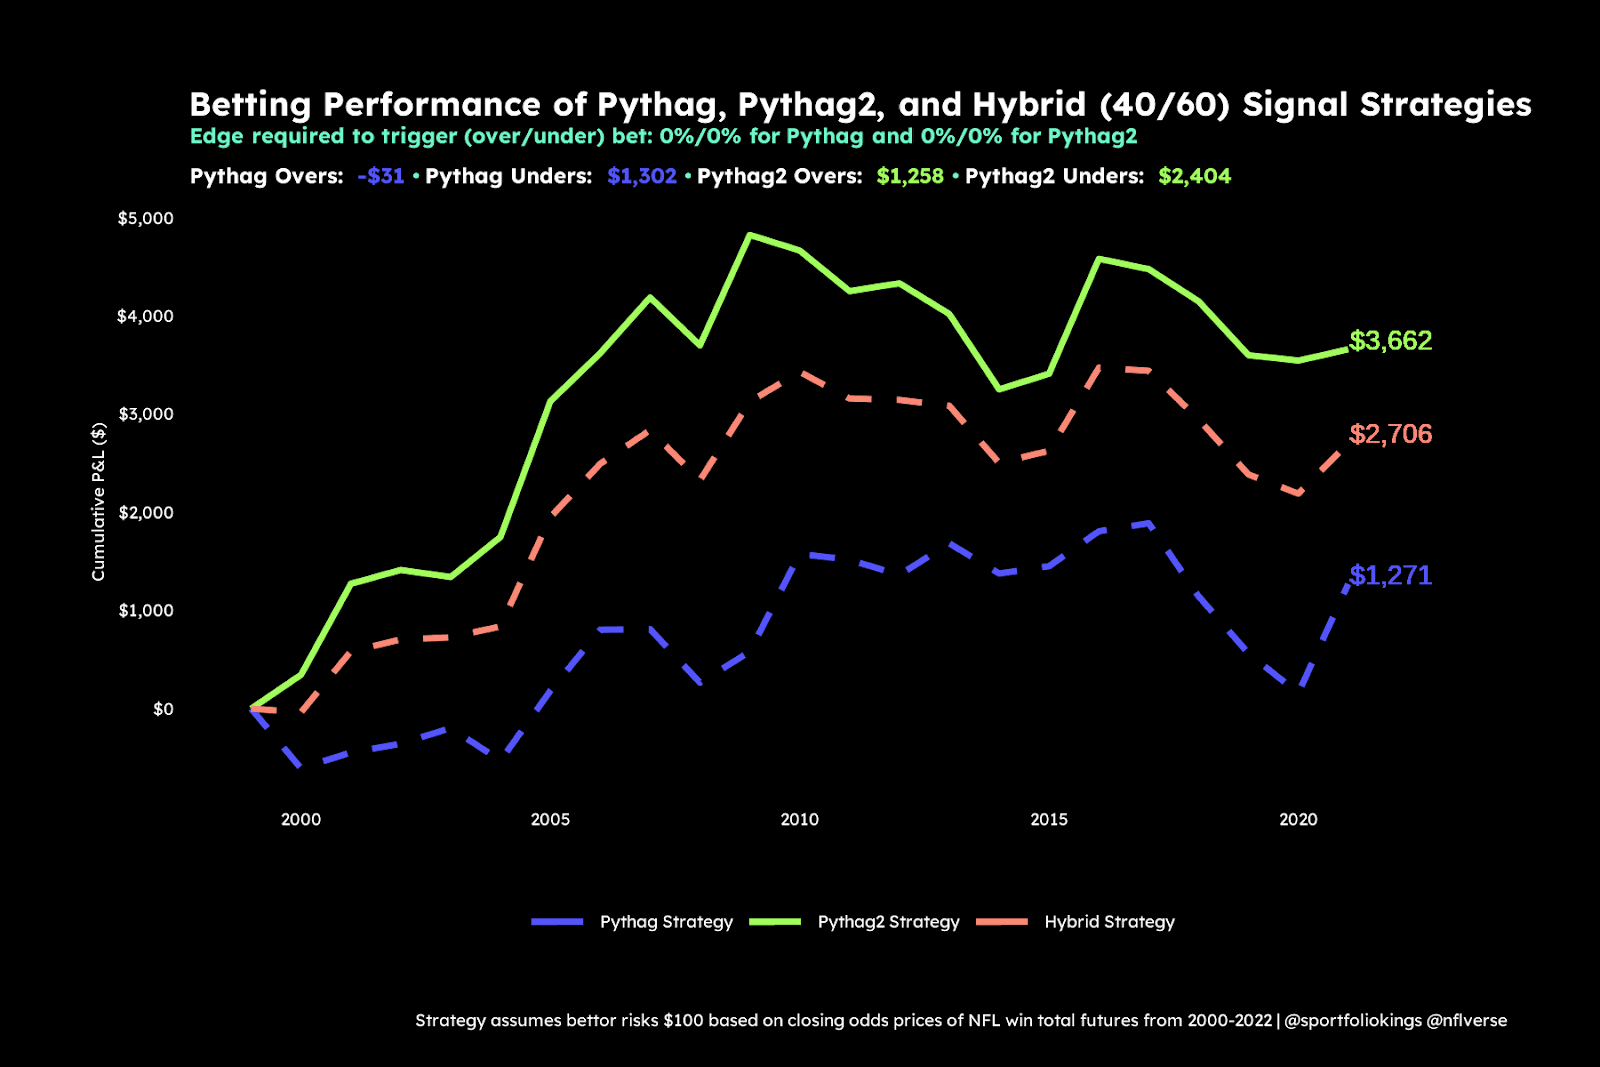
The Pythag 2.0 model decisively tops the chart.
However, it's also important to remember that total returns are just part of the picture. The complexity of properly evaluating betting strategies necessitates taking into account factors like risk exposure, return consistency, volatility, and the potential extent of losses during inevitable losing streaks (“max drawdown”).
The following table presents a holistic overview of these elements for each strategy, with the Sharpe ratio serving as the most important summary performance statistic. It’s a staple in traditional finance and seeks to comprehensively quantify the trade-off between risk and reward in each strategy - a higher score reflecting a more favorable balance.

We can see Pythag 2.0 not only outperforms from a total return perspective but also has comparable volatility to Pythag and with shorter losing streaks. Superb!
10% Edge Strategy
Consider a scenario where we raise our betting threshold to a minimum of a 10% edge. This means that our model's predicted win percentage for a team should differ from the team's actual win percentage by at least 10% — we bet 'over' if it's 10% higher and 'under' if it's 10% lower. This was the threshold we hypothesized would be the approximate ‘right’ level when we used the beta version of Pythag 2.0 last season to make our futures bets, which advised us to take the under on the Packers (Win), over on the Lions (Win), over on the Jaguars (Win), under on the Raiders (Win), and under on the Steelers (Loss).
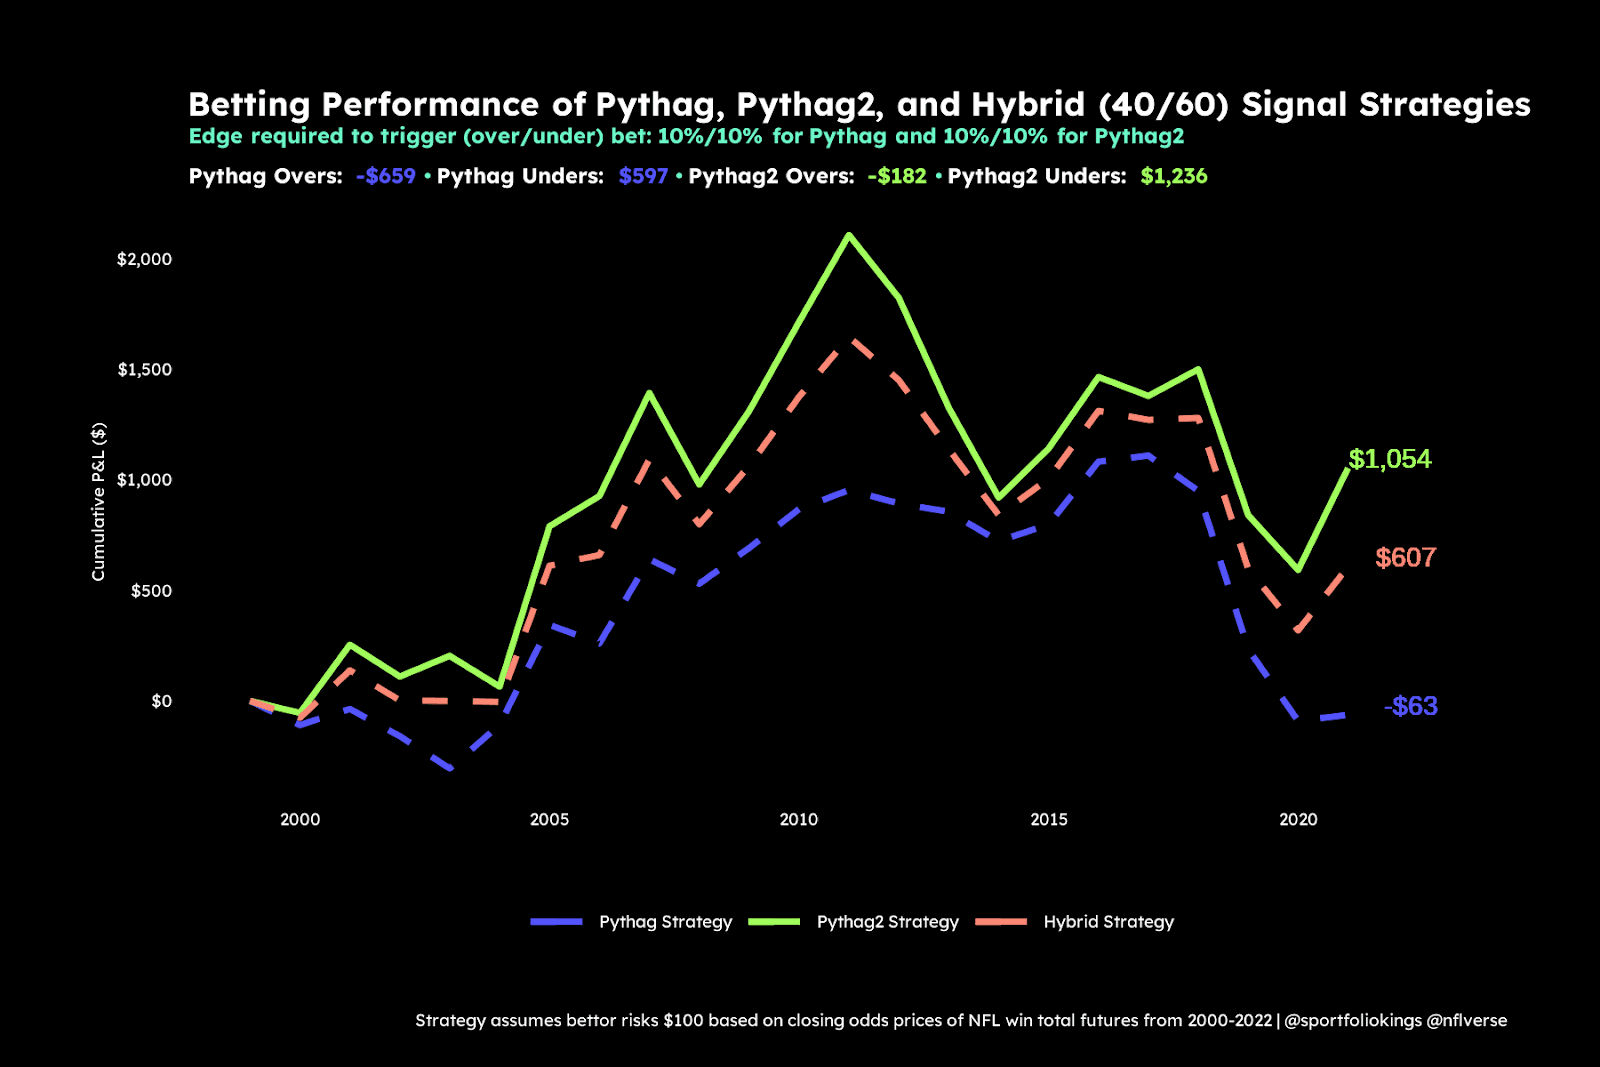

Despite Pythag 2.0 demonstrating increased volatility and sharper downside risk, the total return it achieves more than compensates for these aspects. It also decisively outperforms Pythag (a net negative return over the last two decades - yikes). Even in the face of more considerable risk, Pythag 2.0 yields a significantly better Sharpe ratio, affirming its superior overall risk-reward balance.
5% Edge Strategy
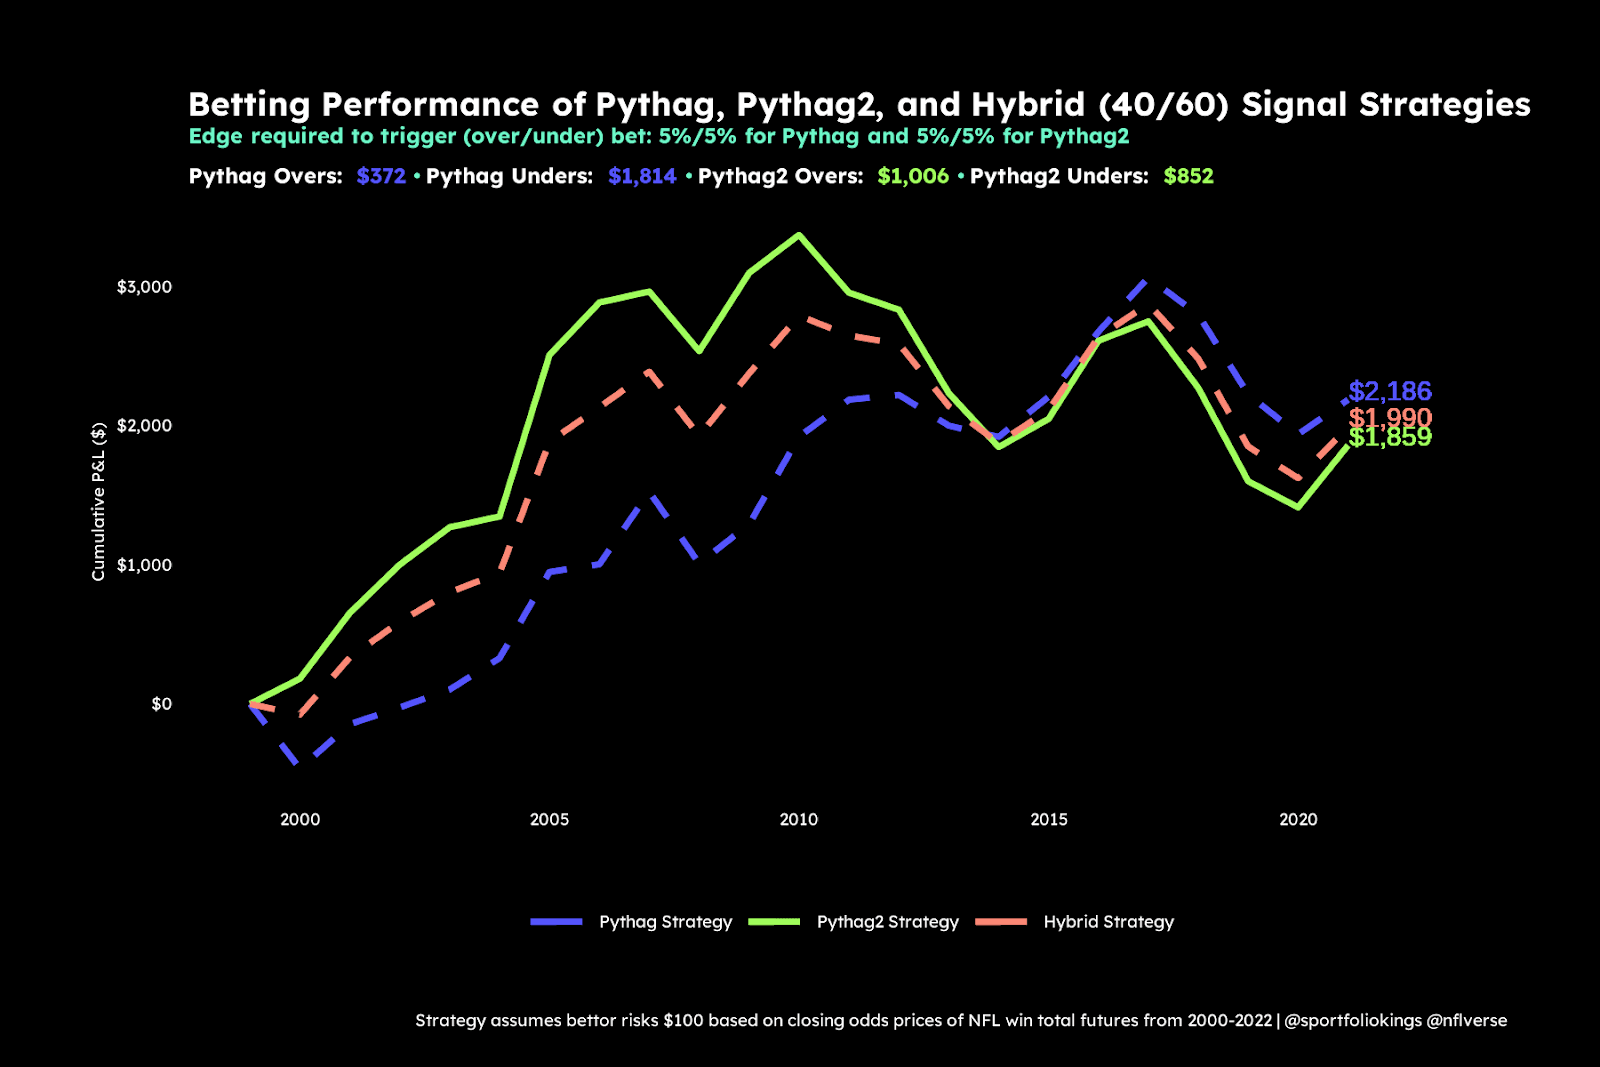
When we reduce the edge threshold to 5%, the performance across the strategies becomes more competitive. Pythag showed a marked underperformance from 2000-2010 but made an impressive comeback over the following decade with substantially less volatility and shallower losing streaks. Maybe Pythag isn’t a total dumpster fire after all?

Profit Optimized Strategy
Suppose we fine-tune the edge thresholds to achieve optimal total return, setting different trigger points for 'over' and 'under' bets for each strategy. While this could be considered somewhat of an 'overfitting' approach, Pythag, when adjusted this way, starts showing considerable improvement in long-term performance. By setting a 5% edge threshold for 'over' bets and a 2% edge threshold for 'under' bets, Pythag delivers robust risk-adjusted returns (Sharpe ratio) with remarkably low volatility and only modest losing streaks. One interesting observation is that a considerable chunk of the Pythag returns are attributable to 'under' bets only, while Pythag 2.0 yields more evenly distributed returns across both 'over' and 'under' bets. This may potentially demonstrate Pythag 2.0’s more acute flexibility when it comes to directional prediction.
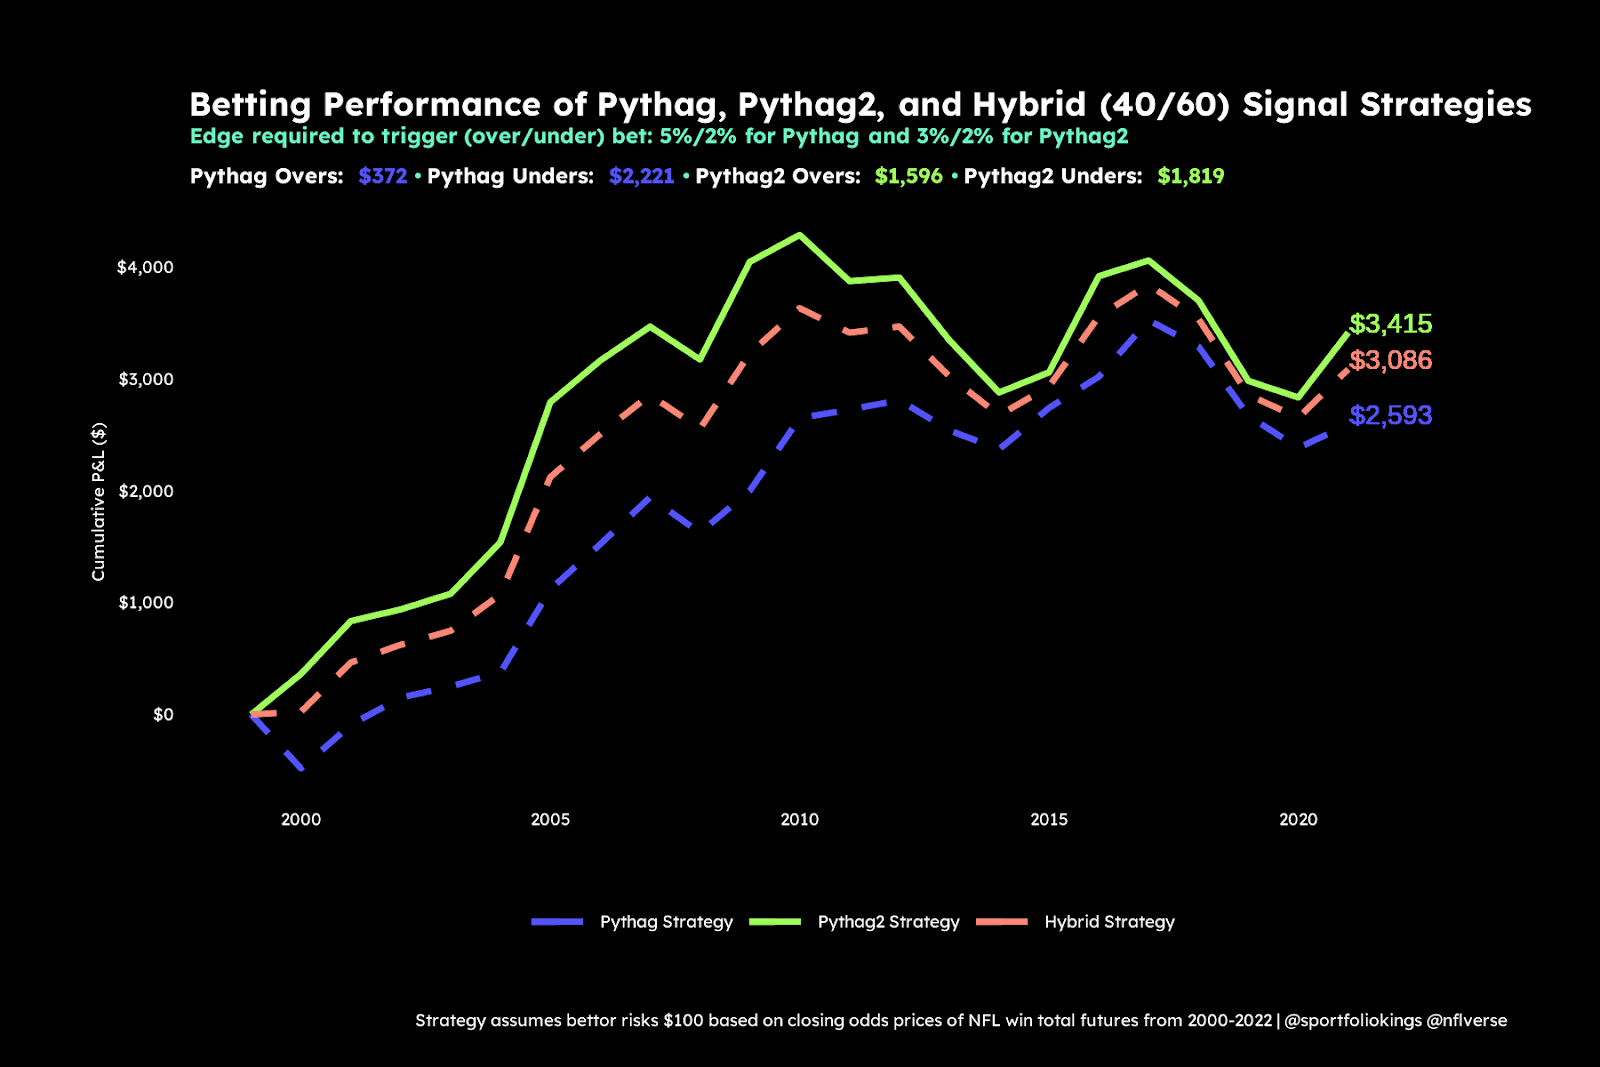

We can also see from these observations that a more nuanced ‘best of both worlds’ mixed strategy — constraining the Pythag model to target 'under' bets and Pythag 2.0 to target 'over' bets — could be an even more promising architecture. Future research will further explore these creative possibilities.
Shorter Time Horizon, Profit Optimized Strategy
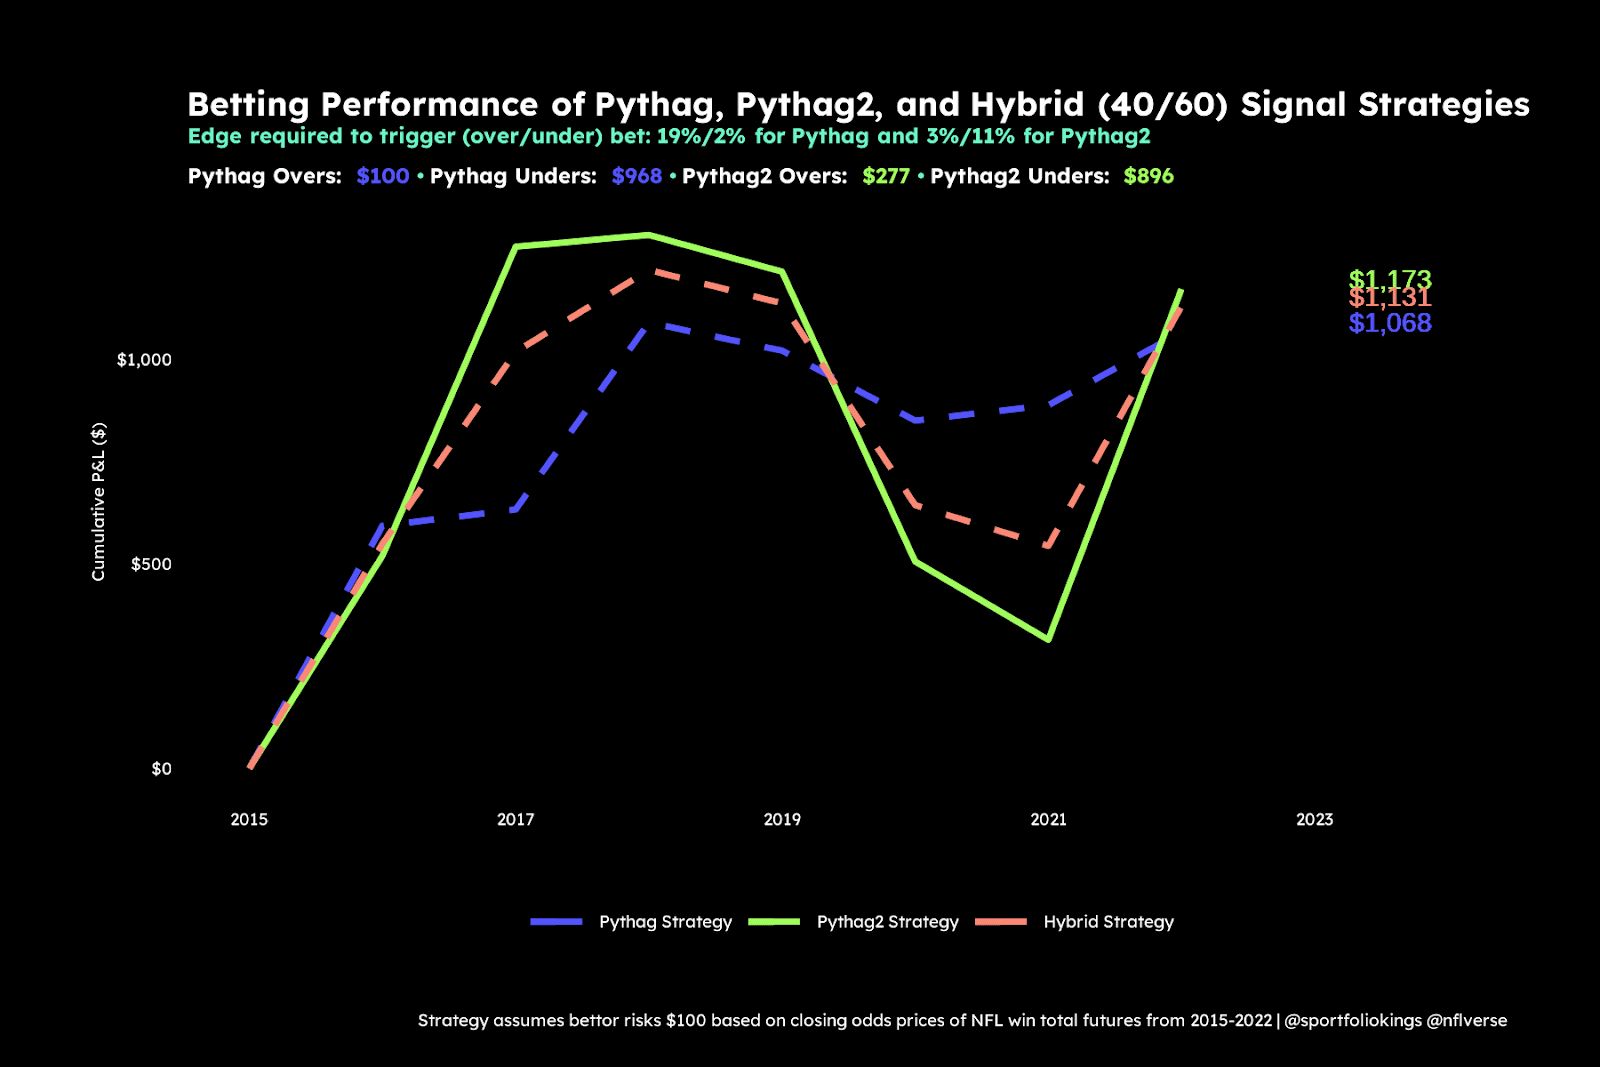
Another notable observation is that the bulk of returns appear front-loaded over the 2000-2010 decade. What do returns across the strategies look like if we cut the relevant time period to 2015-2022, beginning when the extra point was moved back. Again, we see outsized performance from Pythag betting ‘under’ and did so with exceptionally smooth volatility (Sharpe ratio .55). But this time Pythag 2.0 also generated most of its returns from taking on bearish bets. Notice, though, the trigger thresholds are quite inverse, further implying a blended signal could be attractive.
Smoother Bet Triggers

Conclusion
While the classic Pythagorean Expectation may have been a sufficiently reliable torch for bettors over the last decade, our research suggests an enhanced Pythag 2.0 can offer a more predictive punch when it comes to betting NFL win total futures.
However, it's crucial to remember in the field of sports speculation, nothing is certain. Pythag 2.0 represents an improved, market-informed perspective over the OG Pythag approach, but it’s still a naïve betting tool with pronounced and very obvious weaknesses.
Indeed, several intriguing questions remain to be investigated.
Can a re-tooled Pythag 2.0 make accurate predictions on a more tactical week-over-week basis? How should we use our new "Active Points" metrics for in-season forecasting and team pricing purposes? More fundamentally, are there opportunities to further optimize the core Pythag equation? Is the current exponent still the ideal fit for the modern NFL? Should we explore a dynamic exponent as opposed to a static one?
For now, these questions remain open. But at least for the time being, our research does seem to suggest that bettors could benefit from giving equal, if not greater, weight to Pythag 2.0 compared to the traditional Pythag approach when strategizing which NFL futures bets to pull the trigger on in 2023.
We'll outline Pythag 2.0's directional leans for this coming season in our next note.


